
Electrocardiogram (ECG)
last written: March 2009, Kok Lim Kua
last authored:
Introduction
The electrocardiogram (ECG) represents electrical activity originating in the heart and captured on the skin. It is of profound importance in assessing cardiovascular disease and other conditions affecting heart function.
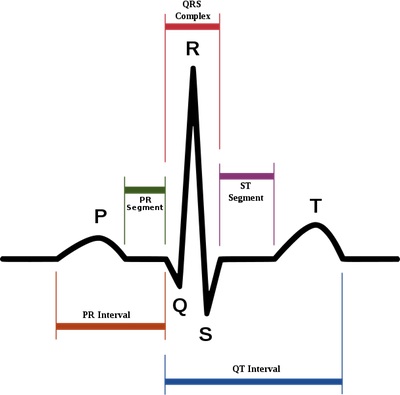
ECG components, from wikipedia
ECG leads provide different information according to where they are placed according to the position of the heart, and each lead measures direction and magnitude from its particular location.
Depolarizations are captured as vertical deflections of varying amplitude, as shown in the figure at left. Electricty towards a lead is positive, while an impulse away from a lead is negative.
Different waveforms signify different aspects of the heart beat. The P wave represents the depolarization of the atria, while the QRS represents ventricular depolarization. The T wave occurs with ventricular repolarization.
The horizontal scale represents time, the standard being 25 mm/sec. Each small box is accordingly 0.04 seconds and each large box 0.20 seconds.
Approach to ECGs
It is critical to approach ECGs in a stepwise, logical manner. Start by confirming the patient's name, another identifier, and the date. Understand the rationale for doing test, including signs and symptoms and past medical history. Be aware of the patient's medications. Lastly, compare to an old ECG if at all possible. As is so often the case, change is one of the most significiant findings.
- rate
- rhythm
- P waves
- PR interval
- QRS complexes
- axis
- ST segment
- T waves
Rate
Normal rate is 60-100 bpm, with everything below or above termed bradycardia or tachycardia, respectively.
There are a few ways to count the rhythm:
Big blocks: 300, 150, 100, 75, 60, 50
60000/small boxes
Rhythm
Assess for sinus rhythm by measuring the interval between a number of R waves. Mark a paper at 3 peaks and slide the paper along to compare spacing.
Sinus rhythm is present there is a QRS after every P, P after every QRS and Narrow QRS complexes.
If sinus rhythm is not present, identify the arrhythmia.
P Waves
The P wave is composed of the contractions of the left and right atria. The right atrium contracts slightly faster than the left. Both RA and LA contractions are positive in lead II, while the RA is positive and the LA negative in lead V1. This can shed some light on enlargements of each.
P wave abnormalities
- Absent P wave and irregular rythm suggests atrial fibrillation
- Saw tooth pattern of P waves depicts A flutter
- Two different P waves suggests ectopic focus that does/does not activate ventricle. Causes including anything that excites atria, including coffee.
- P mitrale: LAH- Prolonged P wave>120msec/3 small boxes,notching/"bipeak" P
wave,Biphasic P wave in Lead V1 with negative deflection >1 small box - P pulmonale: RAH- Peak P wave with amplitude >1 big box
PR Interval
The normal PR interval, measured from the beginning of the P wave to the onset of QRS, is 0.12-0.20 sec, or 3-5 small boxes. It is decreased in junctional rhythms and increased in first degree AV block.
Second and third degree heart block..
If PR interval is shortened, suspect
- left atrial hypertrophy
- ectopic foci that take over pacing
- Wolf-Parkinson-White
QRS Complexes
The normal QRS length, measured from the beginning to the end of the QRS complex, is <0.1 sec, or less than 2.5 small boxes.
Complexes greater than 0.12 seconds are usually due to interventricular conduction delay.
Assess for R wave progression throughout V1-6, morphology, QRS duration and sometimes amplitude. It is better to do the assessment by examining them by regional grouping to identify abnormalities.
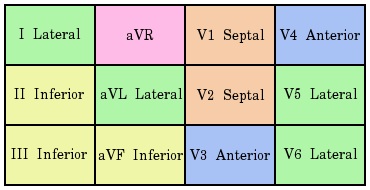
- inferior: II,III,AVF (RCA)
- anterior: V1-4 (?)
- lateral: I, V5-6,aVL (circumflex)
Although each lead represents a unique view, they can be grouped together according to their representative area of the heart. This is particularly important when assessing the possibility of myocardial infarction.
- I, aVL, V3, V6 - lateral
- II, III, aVF - inferior
- aVr
Poor R wave progression can be caused by
- previous MI
- ideopathic
- PE
- LVH
- right ventricular overload
- ?copd
Morpohology - (>1small box for duration + >1/3 height or Rwave), most like indicates previous infarct.
Patterns of Heart block if QRS widened
- M wave on V1-2 and slurred ST segment on V5-6 with right block
- M wave on V5-6 if left block
Sometimes QRS complexes are shorter than 1 small box in amplitude. Causes include:
- low voltage
- athlete
- ischaemia
- pericarditis
- electrolyte abnormality
Axis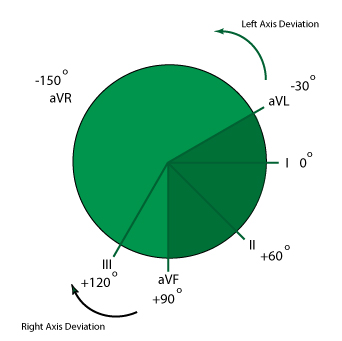
While all information is relevant, the mean QRS axis is the most clinically important and is calaculated from the six limb leads.
Lead I, traveling from right to left, is defined as the 0o axis, and from there all other leads are assigned a relative axis.
A normal axis is between -30 and +90.
A quick way to determine mean QRS axis is to observe which of the six limb leads has the most isoelectric-appearing complex. The mean axis is simply perpindicular to it. It could, however, be +90o or -90o perpendicular, so observing a perpindicular lead for whether or not it is positive will provide that answer.
Another quick way is to assess leads I and II. If the QRS is positive in both, there is likely no axis deviation.
Left axis deviation is more common. It suggests
- mechanical shift (ascites, pregnancy, tumour)
- left ventricular hypertrophy
- left anterior fascicular block
- COPD
- previous anterior/inferior MI
- Wolf-Parkinson-White
Right axis deviation suggests:
- RVH
- left posterior fascicular block
- pulmonary embolus
- mechanical shift (COPD)
- lateral infarction
ST segment
ST depression suggests myocardial ischemia, while ST elevation is representative of myocardial infarction. It is wise to assess it quickly in cases of clinical suspicion due to the potential urgency of what it could suggest.
The ST segment represents a period of relatively little electrical activity in the heart.
The QT interval, measured from the beginning of the Q wave to the end of the T wave, represents the duration of ventricular depolarization and repolarization.
T waves
ECGs is Heart Disease
- ischemia
& infarction - heart
blocks - atrial flutter
& fibrillation - supraventricular
tachycardias - ventricular tach.
& fibrillation - hypertrophy
- bundle branch
blocks - other
Ischemia and Infarction
One of the major reasons for performing ECG is to diagnose acute coronary syndrome, which involves tissue ischemia and/or infarction. Ischemia commonly appears as ST depression, while ST elevation follows infarction, or tissue death. Inverted T waves may also signify ischemia.
Q waves suggest a previous MI.
ST elevation can also be seen with:
- pericarditis
- normal early repolarization (most common in young black men)
As described, different leads monitor different areas of the heart. At least two continuous leads are required to diagnose acute coronary syndrome.
For diagnosis, at least 1mm elevation is required for the limb leads, and at least 2mm elevation in the precordial leads.
continuous leads, from wikipedia
I and aVL: circumflex
II, III, aVF: RCA
V1-V5: LAD
If leads anterior leads (V1,V2) show ST depression, ensure you perform a 15 lead to assess for the possibility of posterior MI.
Heart Blocks
result of conduction disturbance -slowing or blocking - at the AV node.
Waveform
delayed PR intervals
First degree heart block
impulse delayed; prolonged PR interval >.2 s
often idiopathic
rate
usually normal
rhythm
usually regular
Second Degree Heart Block (Mobitz Type I)
PR interval increases intil aQRS complex is dropped
rate
atrial - usually within normal limits (60-100 bpm)
ventrical - slower
rhythm
artial - regular
ventricular- irregular
waveform
normal P waves, though not all followed by QRS
PR interval progressively longer until QRS is dropped
QRS normal
Second Degree Heart Block Type II
get a pacemaker- can progress to Type III
waveform
P waves
normal configuration
not all followed by QRS complexes due to
PR interval - may be normal
Third Degree Heart Block
atria and ventricles beat independently
rate
atria - unaffected - 60-100 bpm
ventricular - slower
rhythm
atria and ventricular - regular
waveform
P waves normal
PR interval - absent
QRS complex - normal if blocked at the AV node; wide if blocked in the bundle branch
Atrial Flutter
rate: atria - 250-350/min; ventricles depend on AV block rhythm: regular; ventricular - variable; dependent on number of atrial beats conducted and on condition ration (ie 4:1)
P waves: not truly present; may appear with sawtooth pattern PR: undefinable QRS: less than 0.12 s
|
Atrial Fibrillation
very common in elderly rate: depends on ventricle response: uncontrolled >100, controlled less <100. Atria: indiscernable 400-500 bpm rhythm: irregularly irregular waveformsP waves, and PR interval, are undefinable wavy baseline QRS complex less than 0.12s
rhythmgrossly irregularly irregular |
Accessory-mediated Supraventricular Tachycardias
Supraventricular Tachycardias (SVTs) are also called narrow rhythm tachycardias. These occur as impuses cycle through abnormal tissue. Usually sudden onset.
rate: > 100/minute; usually 150-250/min
rhythm: sinus
P waves: difficult to detect, as buried within T waves
QRS: narrow
- atrial tachycardia
- paroxysmal atrial tachycardia
- PAT/PSVT/SVT
- atrial flutter
- atrial fibrillation
SVT wave form configurations
P waves: arise from irritable foci above ventricle (not SA node)
significance:
- decreases heart's ability to pump effectively, decreasing perfusion
- thrombi formation can result in emboli
- can be insignificant if it is a perfusing rhythm; rarely progresses
Ventricular Tachycardia
ventricular rate is 100-250 bpm; rhythm is regular.
waveformno P waves, no PR interval QRS complexes normally wide, greater than 0.12s |
Ventricular Fibrillation
rate: indeterminate; can vary rhythm: irregular QRS: no P, QRS, or T waves
fine: peak to trough of 2-5 mm medium: 5-10 mm coarse: >10 mm
|
Left Atrial Hypertrophy (P mitrale)widened, biphasic P wave in II, III, or AVF Left Ventricular Hypertrophy
In adults, R in V6 and S in V1 adding to over 55 mm R in aVL >11 mm. left axis deviation left atrial hypertrophy is also often present, with M-shaped p waves resulting |
Right Atrial Hypertrophy (P pulmonale)peaked P in II, III, or AVF
Right Ventricular Hypertrophy
In adults, R in V1 and S in V5/V6 above 1.10 mV right axis deviation
In kids In V1, upright T wave in days 3-6; q wave, tall R in V1 and deep S in V6 |
Bundle Branch Blocks
Right Bundle Branch Block
QRS widens because RV takes longer to depolarize (3 blocks or more)
An RSR' wave form is seen in lead V1.
Left Bundle Branch Block
Negative (QS wave) in V1, V2
An RSR' wave form is seen in V5 or V6.
An alternate way:
- count the S height in V1 or V2
- count the R height in V5 or V6
- >35 is LVH
Other
- pericarditis - Diffuse ST segment elevation
- right heart overload - get RSR' or rR' in V1, which suggests
Acidosis: smaller amplitude QRS complexes
Hyperkalemia
- wide-complex QRS
- T waves tall and peaked
- small P waves
- sine-wave PEA
hypokalemia
- wide-complex QRS
- T waves flatten
- U waves
- QT prolonged
- tachycardia
hypothermia
- J or Osborne waves
overdose
- predominantly QT prolongation
cardiac tamponade
- narrow complex
- tachycardia
tension pneumothorax
- narrow complex
- bradycardia
ECG in Children
Children are born with right axis deviation (60-180).
The T wave should be inverted in V1 in children. An upright or biphasic T wave is a very good indicator of right ventricular hypertrophy.
Resources and References
http://sprojects.mmi.mcgill.ca/heart/egcyhome.html
ECG simulation and explanation
 |